Generating JavaScript from SVG, an Intro to Code Generation — Part 2
Continuing to generate JavaScript code with htmlparser2 and Babel.
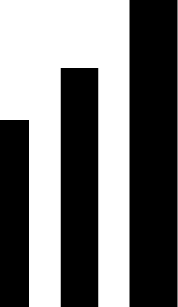
Hi and welcome back to an introduction to code generation. If you haven’t read the first part of this series, we’re trying to generate JavaScript code that will recreate an SVG drawing. In the last part, we managed to write a parser/generator that could understand any drawing, so long as it was made up entirely of black rectangles.
In this part of the series, we’ll add generated code to scale and stretch our image as we resize our Max object. We’re working from the repository at https://github.com/Cycling74/codegen-eng-blog. If you want to pick up where we left off last time, you can checkout the step-2 tag, with something like this:
git checkout tags/step-2Scaling and Stretching
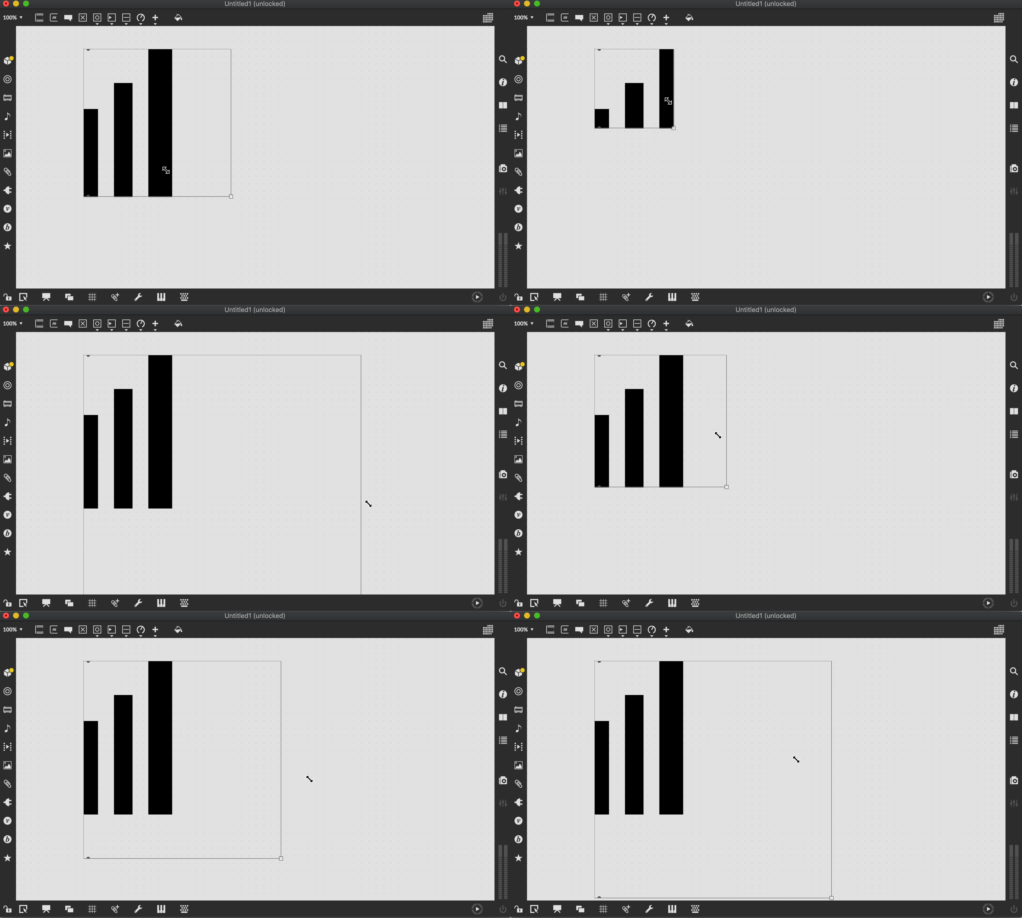
Let’s get started. Right now, if we start to resize our object in Max, our rectangles will just sit there.
Checking the jspainter documentation, there is a way to tell Max to automatically stretch the drawing. mgraphics.relative_coords = 1; at the beginning of our source file will turn on relative coordinate mode, putting (0, 0) in the center of the canvas and (-1, -1) in the top right (I agree, this is an idiosyncratic coordinate system). So now we’ve got to figure out how to convert the coordinates of the rectangles in our SVG file to jspainter’s relative coordinate system. Luckily, looking back at our SVG file, we see that it includes an explicit viewBox="0 0 177.3 307". So all we have to do is extract this while we walk through the SVG file with htmlparser2 and use it to scale our rectangles. There’s one other change: adding mgraphics.relative_coords = 1 to makePaintFunction.
| // ... | |
| // Note the code to specify relative coordinates. | |
| // This will enable relative coordinates and ALSO | |
| // tell Max to resize the drawing automatically. | |
| const makePaintFunction = template(` | |
| mgraphics.relative_coords = 1; | |
| function paint() { | |
| %%statements%% | |
| } | |
| `); | |
| function translateSource(data: string, outPath: string) { | |
| let paintStatements: t.Statement[] = []; | |
| let viewBox: number[]; | |
| const parser = new html2.Parser({ | |
| onopentag(name: string, attribs: {[s: string]: string}) { | |
| if (name === "rect") { | |
| if (viewBox !== undefined) { | |
| let x = t.numericLiteral( | |
| // Scale the absolute coordinates of each rectangle according | |
| // to the bounds of the parent view box. | |
| 2 * Number.parseFloat(attribs.x || "0") / viewBox[2] - 1 | |
| ); | |
| let y = t.numericLiteral( | |
| 2 * Number.parseFloat(attribs.y || "0") / viewBox[3] - 1 | |
| ); | |
| let w = t.numericLiteral( | |
| 2 * Number.parseFloat(attribs.width || "0") / viewBox[2] | |
| ); | |
| let h = t.numericLiteral( | |
| 2 * Number.parseFloat(attribs.height || "0") / viewBox[3] | |
| ); | |
| const rectStatements = makeRectDrawStatements({ x, y, w, h }); | |
| paintStatements = paintStatements.concat(rectStatements); | |
| } else { | |
| console.warn("rect tag outside of svg parent tag with defined viewBox, skipping"); | |
| } | |
| } | |
| else if (name === "svg") { | |
| // When you enter the root svg tag, set the bounds of the viewBox | |
| // Split the viewbox string on spaces and convert to numbers | |
| viewBox = attribs["viewbox"].split(" ").map(Number.parseFloat); | |
| } | |
| } | |
| }); | |
| // ... |
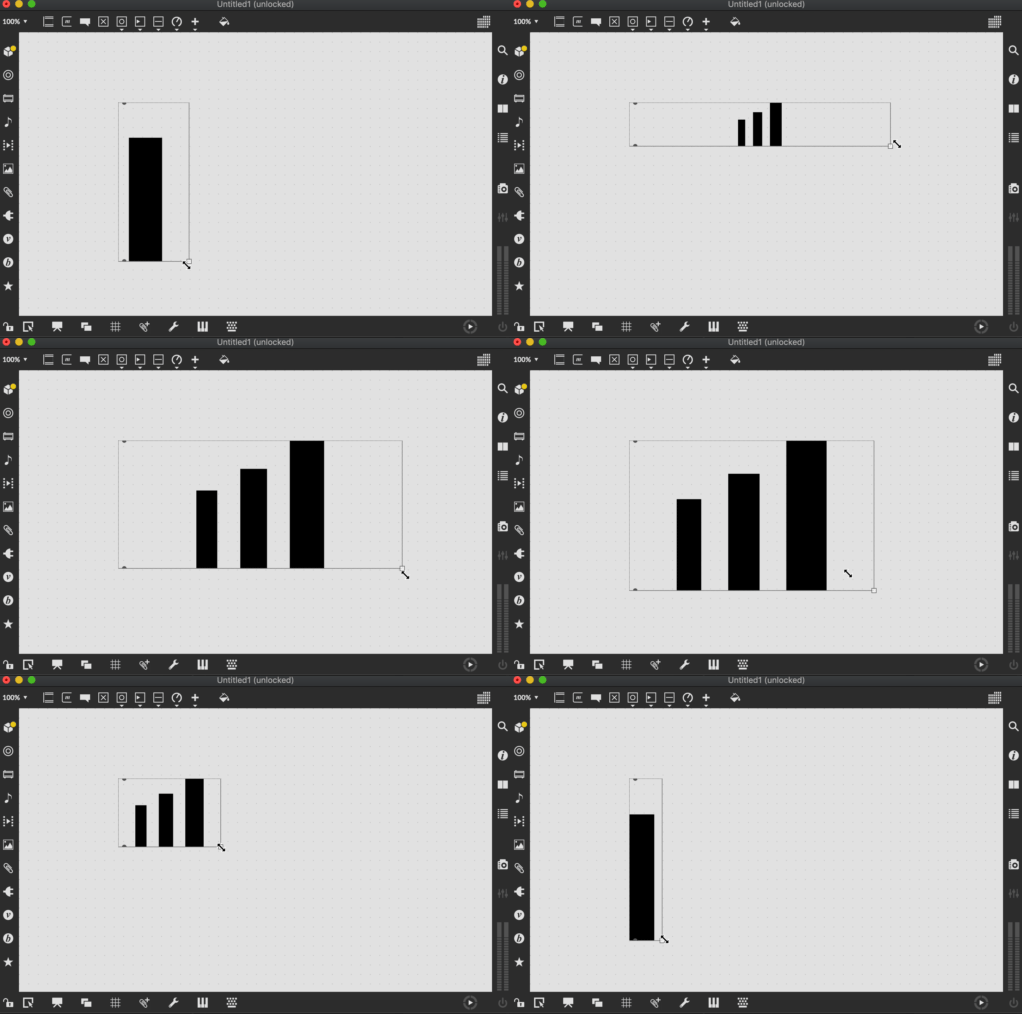
As you can see, the way we scale each rectangle is a little different than how you might expect, since we’re stretching to a coordinate system that goes from (-1, -1) in the top-left to (1, 1) in the bottom right. Or… did we do that scaling right?
That doesn’t look quite right. Ah, right, that’s because I made a mistake: the coordinate system for jspainter actually begins in the bottom left, so (-1, -1) is in the bottom-left and (1, 1) is in the top right. We have to change our scaling code accordingly:
| // This is what the scaling code should actually look like | |
| if (viewBox !== undefined) { | |
| let x = t.numericLiteral( | |
| 2 * Number.parseFloat(attribs.x || "0") / viewBox[2] - 1 | |
| ); | |
| let y = t.numericLiteral( | |
| 1 - 2 * Number.parseFloat(attribs.y || "0") / viewBox[3] | |
| ); | |
| let w = t.numericLiteral( | |
| 2 * Number.parseFloat(attribs.width || "0") / viewBox[2] | |
| ); | |
| let h = t.numericLiteral( | |
| 2 * Number.parseFloat(attribs.height || "0") / viewBox[3] | |
| ); | |
| const rectStatements = makeRectDrawStatements({ x, y, w, h }); | |
| paintStatements = paintStatements.concat(rectStatements); | |
| } else { | |
| console.warn("rect tag outside of svg parent tag with defined viewBox, skipping"); | |
| } |
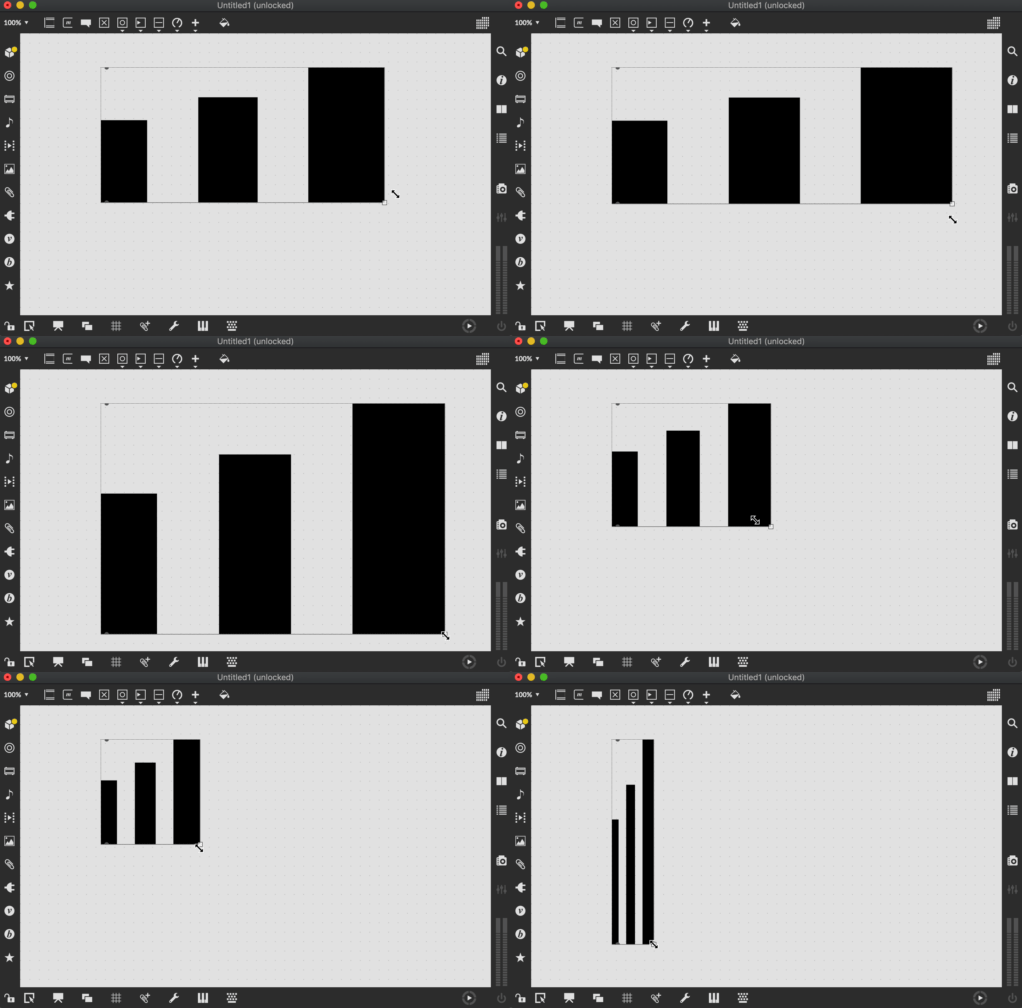
The only bit that’s changed is the y coordinate. With that, we’ve can now resize and see our drawing resize as well.
Aspect Ratios
This is fine so long as we’re happy with a fixed aspect ratio for our drawing. If we want the drawing to scale with the bounds of the object, then we need to incorporate an aspect ratio scaling into our code. The key is that we need to put this logic into the exported code itself. What’s kind of cool about this is that now we’re defining behavior that isn’t present in the original SVG file. First, we add a function to calculate aspect ratio to our generated paint code.
| const makePaintFunction = template(` | |
| mgraphics.relative_coords = 1; | |
| function calcAspect() { | |
| var width = this.box.rect[2] - this.box.rect[0]; | |
| var height = this.box.rect[3] - this.box.rect[1]; | |
| return width/height; | |
| } | |
| function paint() { | |
| const aspect = calcAspect(); | |
| %%statements%% | |
| } | |
| `); |
As you can see, this adds a local aspect variable to our paint function. Now, since our rectangle drawing functions are just lists of statements in the paint function, we can make use of this local variable in our rectangle drawing code. We don’t have to pass the aspect variable to the rectangle function or anything like that, we can just use the local aspect variable directly.
| const makeRectDrawStatements = template(` | |
| mgraphics.rectangle(%%x%% * aspect, %%y%%, %%w%% * aspect, %%h%%); | |
| mgraphics.fill(); | |
| `); |
Surprisingly that’s all we need to do to get a drawing that will stretch to whatever aspect ratio we want in Max.
Home Stretch
If you want to jump ahead and see all the code we wrote in this section, checkout the step-3 tag:
git checkout tags/step-3In the last part of the series, we’ll break with our monochromatic streak and see how to add some color to our drawing. Look out for some CSS-parsing action in the exciting conclusion to our code generation intro series!


